 Nothing found for the request

Casino Industry Market Reports: 2026 Data & Trends
Sologe March 30, 2026
Share:


Understanding Casino Market Report Categories
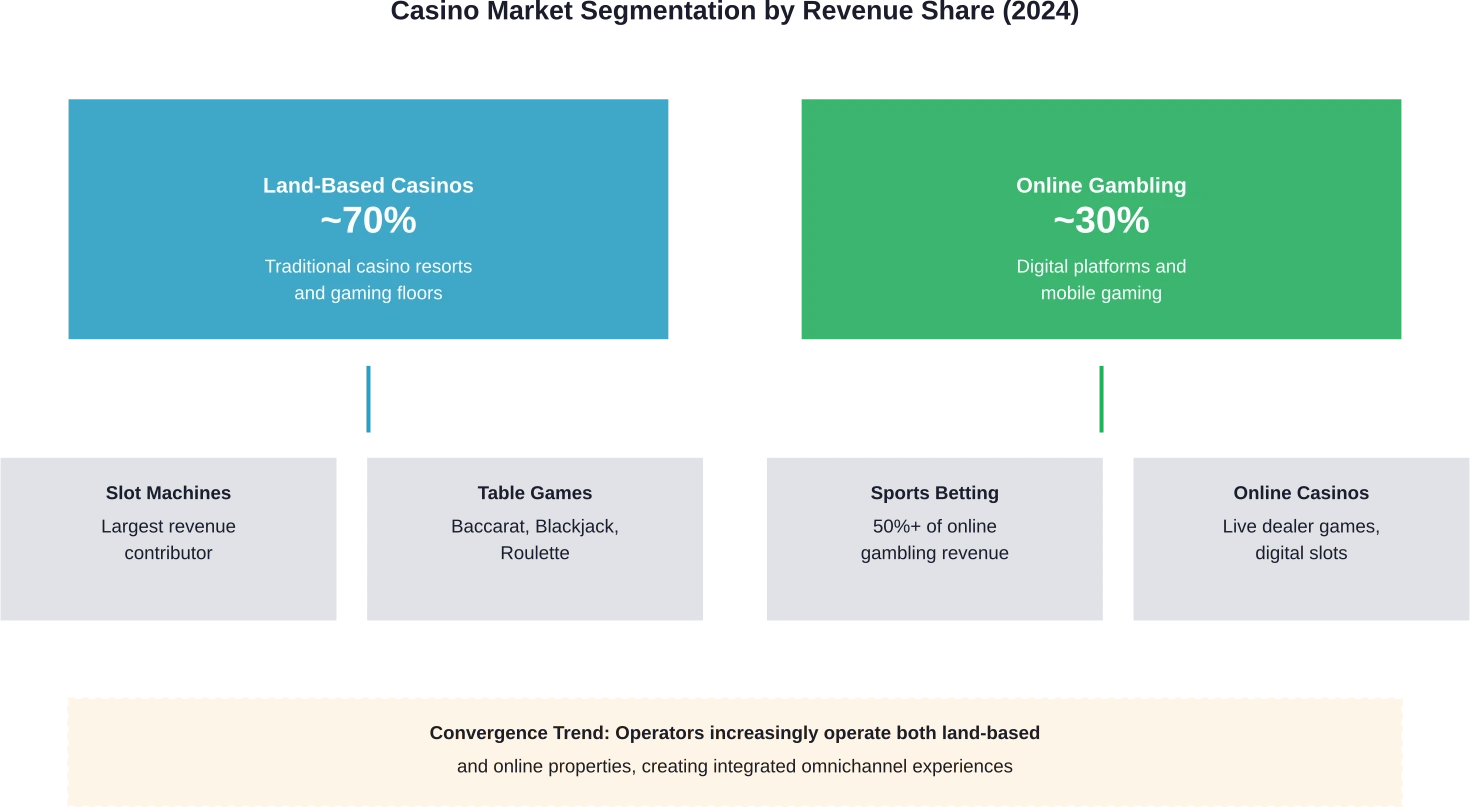
Casino industry reports generally split into distinct segments that measure different aspects of the gambling ecosystem. The broadest divide separates land-based casino operations from online gambling platforms, though the boundaries increasingly blur as traditional operators launch digital properties.
Statista projects the entire global gambling market will reach USD 655.31 billion in 2026, with expected annual growth of 2.28% (CAGR 2026-2030), resulting in a projected market volume of USD 717.06 billion by 2030. This broader figure encompasses lotteries, bingo, sports betting, and all casino gaming—both physical and digital.
Land-Based Casino Market Dynamics
Traditional casino resorts remain the industry’s foundation, particularly in established markets like Las Vegas, Macau, and Singapore. These properties combine gaming floors with integrated resort amenities—hotels, restaurants, entertainment venues, and convention spaces.
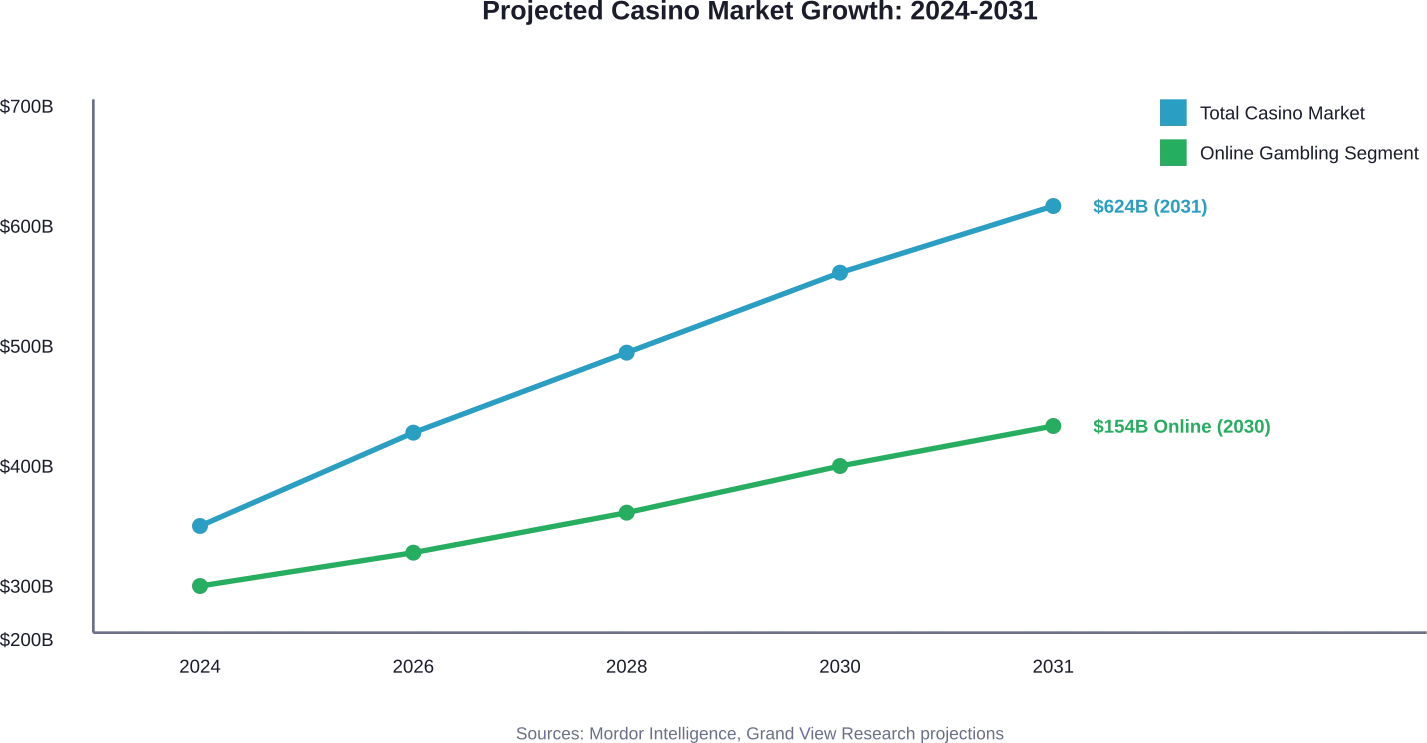
Market Data Forecast notes the global casino market was valued at USD 308.52 billion in 2024 and is projected to grow from USD 328.48 billion in 2025 to USD 542.41 billion by 2033, with a CAGR of 6.47%. This segment includes everything from tribal casinos in the United States to luxury gaming complexes on the Cotai Strip.
Land-based reports typically track metrics like revenue per gaming position, table game drop and hold percentages, slot machine win rates, and hotel occupancy tied to casino visitation. The UNLV Center for Gaming Research maintains detailed historical data on Nevada casino operations, including departmental income breakdowns and game mix evolution from 1985 through 2024.
Online Gambling Market Explosion
Digital gambling platforms represent the industry’s fastest-growing segment. Grand View Research estimates the global online gambling market size was estimated at USD 78.66 billion in 2024 and is projected to reach USD 153.57 billion by 2030, growing at a CAGR of 11.9% from 2025 to 2030.
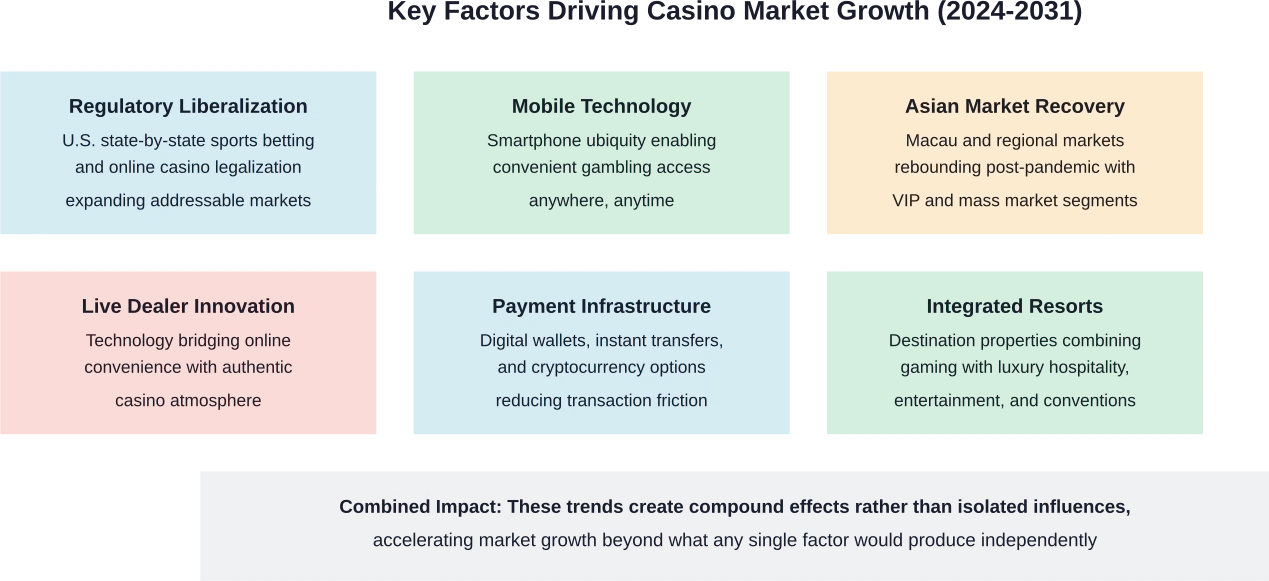
This rapid expansion reflects several converging trends: smartphone ubiquity, improving mobile payment infrastructure, live dealer technology that replicates casino atmosphere, and progressive legalization in previously restricted markets.
Sports betting dominates online gambling, with the sports betting segment accounting for a revenue share of over 50% in 2024 according to Grand View Research. Desktop devices still account for significant revenue in online gambling, though mobile is capturing increasing share as younger demographics enter the market and apps improve.
Regional Market Analysis and Growth Hotspots
Geography matters enormously in casino market analysis. Regulatory environments, cultural attitudes toward gambling, economic development levels, and tourism infrastructure create wildly different market conditions across regions.
Asia-Pacific: The Industry’s Revenue Engine
Asia-Pacific represents both the largest and fastest-growing casino market globally. Macau alone generated gaming revenue that dwarfs Las Vegas, though the region experienced significant volatility during pandemic-related restrictions.
According to Mordor Intelligence, Asia-Pacific anchors global casino growth, with Macau and Singapore serving as primary revenue centers. Selective greenfield projects in the Middle East are establishing new destination resorts that combine gaming with luxury hospitality, creating a fresh frontier for integrated resort development.
The Macau Gaming Inspection and Coordination Bureau provides detailed gross gaming revenue data showing recovery patterns following border reopenings. Regional operators like Galaxy Entertainment and Genting Group compete alongside American brands for market share in these high-stakes markets.
North American Digital Transformation
North America’s casino market is undergoing rapid transformation driven by sports betting legalization across U.S. states. Grand View Research estimates the North America online gambling market size was estimated at USD 16.56 billion in 2024 and is expected to grow at a CAGR of 12.2% from 2025 to 2030.
The U.S. online gambling market size was estimated at USD 12.68 billion in 2024 and is expected to grow at a CAGR of 9.8% from 2025 to 2030. Sports betting accounts for over 24% of the U.S. online gambling segment as of 2024, with state-by-state regulatory frameworks creating a complex patchwork of legal markets.
Traditional Las Vegas operators like MGM Resorts and Caesars Entertainment have launched digital platforms to capture online market share, competing against pure-play digital operators and daily fantasy sports companies that pivoted into sports betting.
Middle East and Africa: Emerging Opportunities
The Middle East and Africa represent the fastest-growing regional market according to multiple reports, though from a smaller revenue base. This growth reflects carefully controlled casino resort development in select jurisdictions that permit gaming.
Integrated resorts in this region typically emphasize luxury hospitality, entertainment, and dining alongside gaming floors, positioning themselves as international tourist destinations rather than gambling-focused properties.
Key Players and Competitive Landscape
Casino market concentration sits at medium levels according to Mordor Intelligence, with several dominant players controlling significant market share while numerous regional and specialized operators fill niche positions.
Operator | Primary Markets | Competitive Strengths |
|---|---|---|
Las Vegas Sands | Macau, Singapore, U.S. | Integrated resort expertise, convention facilities, Asian market leadership |
MGM Resorts International | Las Vegas, Regional U.S., Macau, Digital | Iconic Las Vegas properties, sports partnerships, growing online presence |
Caesars Entertainment | Las Vegas, Regional U.S., Digital | Loyalty program strength, property portfolio breadth, online gambling platform |
Galaxy Entertainment | Macau | Dominant Macau position, luxury resort development, Asian customer relationships |
Genting Group | Southeast Asia, U.K., U.S. | Diversified geographic footprint, integrated entertainment offerings |
These operators compete on multiple dimensions: property quality and amenities, gaming floor variety and limits, loyalty program benefits, hotel and restaurant offerings, entertainment programming, and increasingly, digital platform capabilities.
Recent industry developments show continued consolidation as larger operators acquire regional properties, alongside aggressive expansion into online gambling markets where regulations permit. Traditional casino companies face competition from technology-focused online gambling specialists who lack physical properties but excel at digital user acquisition and retention.
Critical Metrics in Casino Market Reports
Understanding what market reports actually measure helps evaluate their utility for specific decision-making needs. Different stakeholders care about different metrics.
Revenue Measurement Methodologies
Gross gaming revenue represents the fundamental metric—total amount wagered minus winnings paid to customers. This differs from handle (total amount wagered) and is distinct from net revenue (gross gaming revenue minus promotional allowances and other costs).
The American Gaming Association reported that the U.S. commercial gaming industry generated a record $60.4 billion in revenue in 2022. Revenue figures vary across reports based on what they include: some measure only gaming floor revenue, others incorporate hotel, food and beverage, and entertainment revenue from casino properties.
Online gambling revenue measurement faces additional complexity. Some reports count gross gaming revenue, others track deposits minus withdrawals, and still others measure operator revenue after bonuses and promotions. Comparing figures across reports requires understanding these methodological differences.
Market Size Versus Market Value
Market size typically refers to total transaction volume—the aggregate amount wagered or total revenue generated across all operators in a defined segment. Market value might refer to the total valuation of publicly traded casino companies, or the estimated value of casino licenses and properties.
This distinction matters when evaluating investment opportunities. A large market size with many competitors might offer lower profit margins than a smaller but more concentrated market with higher barriers to entry.
Growth Rates and CAGR Projections
Compound annual growth rate projections appear throughout casino market reports, but these forecasts carry significant uncertainty. Regulatory changes, economic downturns, pandemic-style disruptions, and technology shifts can dramatically alter growth trajectories.
The online gambling market’s projected 11.9% CAGR through 2030 assumes continued regulatory liberalization and technology adoption. Land-based casino growth projections of 6-7% CAGR assume recovering international travel and stable consumer spending.
Technology Trends Reshaping Market Dynamics
Technology isn’t just changing how people gamble—it’s fundamentally altering market structure and competitive dynamics in ways that market reports are still learning to measure.
Mobile Gaming and App Ecosystems
Smartphone penetration has transformed online gambling from desktop-based websites to mobile-first experiences. Grand View Research notes that while desktop devices still account for significant revenue in online gambling, mobile is capturing increasing share as younger demographics enter the market and apps improve.
Mobile gambling apps offer geolocation verification for regulatory compliance, seamless payment integration, push notifications for promotions and live betting opportunities, and social features that connect players. These capabilities create stickier customer relationships and higher lifetime value compared to desktop-only experiences.
Live Dealer Technology and Casino Atmosphere
Live dealer games address a fundamental challenge of online gambling: replicating the social atmosphere and trust of physical casinos. By streaming real dealers operating physical cards and roulette wheels, these games bridge digital convenience with authentic casino experience.
Market reports increasingly track live dealer revenue as a distinct category. The technology requires specialized studios, professional dealers, multiple camera angles, and chat functionality—creating higher operating costs but commanding premium player engagement and retention.
Cryptocurrency and Blockchain Integration
Cryptocurrency adoption in online gambling has expanded significantly, offering faster transaction processing, lower fees, and enhanced privacy compared to traditional payment methods. Some operators accept Bitcoin, Ethereum, and other cryptocurrencies alongside fiat currency.
Grand View Research notes that as cryptocurrencies grow in popularity, their role in online gambling is expected to expand considerably in coming years. Blockchain-based gambling platforms promise provably fair gaming through transparent smart contracts, though regulatory uncertainty around cryptocurrency gambling remains substantial.
Regulatory Environment and Market Access
Casino market dynamics are inseparable from regulatory frameworks that determine where and how gambling can operate legally. Understanding regulatory trends is essential for interpreting market projections.
U.S. State-by-State Legalization
The United States has shifted from a primarily Nevada-centric casino market to a complex patchwork of state-level regulations. Following the Supreme Court’s 2018 decision striking down the federal sports betting ban, more than 30 states have legalized sports betting, with many also permitting online casino gaming.
This regulatory expansion explains the aggressive growth projections for North American online gambling. Each new state that legalizes online gambling creates a fresh market for operators to enter, though state-specific licensing requirements, tax rates, and operational rules create compliance complexity.
European Market Maturity and Consolidation
European gambling markets are generally more mature, with many countries having established online gambling frameworks years before U.S. states. This maturity means slower growth rates but more stable regulatory environments.
European operators face strict responsible gambling requirements, advertising restrictions, and consumer protection mandates that shape market structure. These regulations favor larger, well-capitalized operators who can afford compliance infrastructure.
Asian Market Potential and Restrictions
Asia represents the largest untapped market potential and the most restrictive regulatory environment. China prohibits gambling except in Macau, Japan recently legalized integrated resorts after decades of prohibition, and many Southeast Asian countries maintain strict gambling bans.
Market reports projecting strong Asia-Pacific growth typically assume continued Macau recovery, successful integrated resort launches in Japan, and potential regulatory liberalization in additional jurisdictions. These assumptions carry significant uncertainty.
Investment Considerations and Market Entry Strategies
Casino market reports serve different audiences with distinct objectives: public equity investors evaluating casino stocks, private equity firms considering operator acquisitions, equipment manufacturers assessing demand for gaming machines, and entrepreneurs exploring market entry opportunities.
Public Market Valuations and Operator Performance
Publicly traded casino operators provide transparent financial data through SEC Form 10-K filings. These documents detail revenue by property and segment, capital expenditure plans, debt levels, and management’s assessment of market conditions and risks.
Casino stocks trade on metrics like EBITDA multiples, revenue per square foot of gaming space, and market share in key jurisdictions. Analyst coverage focuses on Las Vegas Strip trends, Macau gaming revenue recovery, online gambling customer acquisition costs, and regulatory developments.
Land-Based Property Development Economics
Developing new casino resorts requires massive capital investment—often exceeding $1 billion for integrated resorts in major markets. Market reports help developers assess whether projected gaming and hospitality revenue justifies construction costs.
Feasibility studies examine competitive positioning, market cannibalization effects, estimated market share capture, construction timelines, and required returns on invested capital. The high fixed costs and long development timelines make these projects particularly sensitive to market demand assumptions.
Online Platform Market Entry Barriers
Launching online gambling platforms faces different challenges: technology development or licensing, obtaining gaming licenses across multiple jurisdictions, establishing payment processing relationships, customer acquisition in crowded digital markets, and achieving sufficient scale to cover fixed costs.
Market reports showing rapid online growth attract new entrants, but customer acquisition costs have risen substantially as competition intensifies. Established operators with brand recognition and cross-marketing capabilities from physical properties hold significant advantages.
Market Entry Strategy | Capital Requirements | Key Success Factors | Primary Risks |
|---|---|---|---|
Integrated Resort Development | $500M – $5B+ | Prime location, luxury positioning, Asian market access | Regulatory approval, construction delays, demand shortfall |
Regional Casino | $100M – $500M | Local market monopoly, convenient access, community support | Competition from nearby states, economic sensitivity |
Online Platform Launch | $10M – $100M | Technology quality, marketing efficiency, license portfolio | Customer acquisition costs, regulatory changes, competition |
Casino Equipment Supply | $1M – $50M | Product innovation, operator relationships, regulatory approval | Technology obsolescence, market concentration |
Data Sources and Research Methodologies
Not all casino market reports are created equal. Understanding where data comes from and how projections are generated helps assess report reliability and applicability to specific decisions.
Primary Versus Secondary Research
Primary research involves direct data collection through surveys of casino operators, interviews with industry executives, mystery shopping of online platforms, and analysis of proprietary transaction data. This research provides fresh insights but is expensive and time-consuming.
Secondary research compiles existing data from regulatory filings, publicly available statistics, industry association reports, and previously published studies. Secondary research is faster and cheaper but may recycle outdated assumptions or miss emerging trends.
The most valuable market reports combine both approaches: using secondary sources for historical baseline data and market structure, supplemented with primary research to validate projections and identify new developments.
Regulatory Data and Official Statistics
Gaming regulatory agencies publish detailed revenue data for jurisdictions under their oversight. The Nevada Gaming Control Board, New Jersey Division of Gaming Enforcement, Macau Gaming Inspection and Coordination Bureau, and similar agencies worldwide provide monthly or quarterly revenue reports.
The UNLV Center for Gaming Research maintains extensive archives of Nevada casino statistics, including statewide and regional revenue breakdowns, game mix evolution, and historical trends dating to the 1980s. These official statistics provide the most reliable historical data for U.S. and Macau markets.
Academic research from institutions like Michigan State University’s business library and UNLV’s gaming research programs offers peer-reviewed analysis of casino markets, though these studies may focus on specific questions rather than comprehensive market sizing.
Commercial Market Research Firms
Companies like Grand View Research, Mordor Intelligence, Market Data Forecast, and Statista produce commercial casino market reports sold to industry participants and investors. These reports aggregate data from multiple sources, conduct proprietary analysis, and generate market projections.
Report quality varies. The most rigorous clearly document data sources, explain methodology, acknowledge limitations and uncertainty ranges, and distinguish between historical data and forward projections. Less reliable reports may present projections as facts or lack transparency about assumptions.
Emerging Trends and Future Market Directions
Several developing trends will shape casino markets over the next five to ten years, though their ultimate impact remains uncertain.
Social Casino Gaming and Real Money Convergence
Social casino games—free-to-play apps that simulate gambling without real money wagering—have cultivated massive audiences. These platforms monetize through in-app purchases of virtual currency and items rather than gambling revenue.
The boundary between social gaming and real money gambling is blurring. Some operators offer both social casino apps and real money gambling platforms, using the former as customer acquisition channels for the latter. Regulatory frameworks haven’t fully adapted to this convergence, creating ambiguity about what constitutes gambling versus gaming.
Sports Betting Integration and In-Game Wagering
Sports betting’s rapid growth reflects not just legalization but product innovation. In-game betting on live sporting events creates engagement opportunities that traditional pre-game wagering couldn’t match. Betting on individual plays, possessions, or at-bats keeps bettors engaged throughout games.
Partnerships between sports leagues, teams, and gambling operators are proliferating. Official data partnerships, integrated betting content in broadcasts, and stadium sportsbooks create multiple touchpoints between sports consumption and gambling.
Artificial Intelligence and Personalization
AI applications in gambling span responsible gaming monitoring, fraud detection, game optimization, and marketing personalization. Machine learning algorithms can identify problem gambling patterns, detect coordinated fraud rings, optimize slot machine configurations, and personalize promotional offers to individual players.
These capabilities create competitive advantages for operators with sophisticated data infrastructure and analytics teams. They also raise privacy concerns and regulatory questions about algorithmic fairness and manipulation.
Market Report Limitations and Interpretation Cautions
Market reports provide valuable frameworks for understanding industry dynamics, but users should recognize their inherent limitations.
Projection Uncertainty and Scenario Analysis
Five-year CAGR projections inherently contain enormous uncertainty. Economic recessions, pandemic-scale health crises, major regulatory changes, and technology disruptions can invalidate baseline assumptions.
Sophisticated analysis considers multiple scenarios: a base case reflecting current trends, an optimistic case assuming favorable regulatory and economic conditions, and a pessimistic case accounting for potential disruptions. Single-point projections without sensitivity analysis provide false precision.
Geographic and Segment Aggregation
Global market figures aggregate wildly different regional dynamics. Asia-Pacific and North American markets have little in common beyond both involving casino gaming. Reporting them as a single global market obscures more than it reveals.
Similarly, combining land-based and online gambling into total market figures masks divergent growth trajectories and competitive dynamics. Online gambling at 12% CAGR and land-based casinos at 6% CAGR represent fundamentally different investment opportunities.
Competitive Intelligence Limitations
Market reports describe industry structure and major players but rarely provide detailed competitive intelligence about specific operators’ strategies, cost structures, or proprietary capabilities. Publicly available data has limits for competitive analysis.
Private operators—particularly in online gambling—don’t disclose detailed financial and operational data. Market reports must estimate their performance based on partial information, creating uncertainty about actual market share and growth rates.
Practical Applications: Using Market Reports Effectively
Different stakeholders extract different insights from casino market reports depending on their decision-making needs.
For Investors and Financial Analysts
Public equity investors use market reports to contextualize individual casino operator performance. Is a company gaining or losing market share? Are its growth rates above or below industry averages? How do valuation multiples compare to peers?
Market reports provide the denominator for market share calculations and benchmark growth expectations. But they shouldn’t substitute for detailed company-specific analysis of competitive positioning, management quality, balance sheet strength, and operational execution.
For Casino Operators and Industry Participants
Operators use market intelligence for strategic planning: identifying attractive markets for expansion, assessing competitive intensity, benchmarking performance metrics, and forecasting demand for capacity planning.
Equipment suppliers and service providers use market reports to identify growth segments and allocate sales resources. If online gambling is growing at 12% while land-based casinos grow at 6%, technology vendors might prioritize online platform development over physical gaming machines.
For Policymakers and Regulators
Government officials considering gambling legalization or regulation changes use market reports to estimate potential tax revenue, economic development impacts, and social costs. Projections of market size help forecast tax collections under different rate structures.
Regulatory agencies use market data to monitor industry health, identify emerging problems like excessive market concentration, and calibrate oversight resources to match industry growth.
Turn Market Data Into Action with the Right Partners

Market reports show where the casino industry is heading, but acting on that data usually means working with multiple providers across platforms, games, payments, and services. Managing all of that separately slows things down. Sologe brings this into one place as a B2B marketplace, where operators and developers can find and connect with the partners they need to move from insight to execution.
If you’re using market data to plan your next steps, this is where structure starts to matter. Instead of handling everything piece by piece, align your setup early. Get in touch with the Sologe team, review your options, and start building with the right partners in place.
Frequently Asked Questions
What is the current size of the global casino market?
The global casino market is valued between $300 billion and $360 billion in 2024–2026.
How fast is the online gambling market growing?
It is growing at nearly 12% annually, significantly faster than land-based casinos.
Which regions are growing the fastest?
Asia-Pacific leads in size, while the Middle East and Africa show the fastest growth.
What are the main casino market segments?
The market is divided into land-based and online segments, further broken down by games, devices, and regions.
How accurate are market projections?
They provide useful direction but may vary due to regulation and economic changes.
Who are the biggest casino companies?
Top players include Las Vegas Sands, MGM Resorts, Caesars, Galaxy Entertainment, and Genting.
Where can I find reliable casino market data?
Check official regulators, academic research centers, and major market research firms.
Conclusion: Navigating Casino Market Intelligence
Casino industry market reports provide essential frameworks for understanding a complex, rapidly evolving sector generating hundreds of billions in annual revenue. The data shows clear trends: robust overall growth with land-based casinos expanding steadily while online platforms surge at double the rate, geographic shifts toward Asian dominance with North American digital transformation, and technology-driven business model innovation reshaping competitive dynamics.
But the numbers tell only part of the story. Effective use of market reports requires understanding what they measure and what they miss, recognizing the assumptions underlying projections, and contextualizing quantitative data with qualitative industry knowledge. A projection that online gambling will reach $154 billion by 2030 means little without understanding regulatory pathways, competitive positioning, and technology trends that could accelerate or derail that growth.
The casino industry stands at an inflection point. Regulatory barriers that constrained growth for decades are falling across North America. Technology has eliminated geography as a constraint for gambling access. New customer segments are entering markets through mobile apps and sports betting. Established operators face competition from technology companies lacking casino experience but bringing digital expertise.
For investors, operators, suppliers, and policymakers, market reports provide the data foundation for navigating this transformation. The key is using them as starting points for deeper analysis rather than definitive answers. Check multiple sources, understand methodologies, focus on trends rather than precise figures, and supplement quantitative data with qualitative market intelligence.
The next five years will determine whether the industry delivers on growth projections or encounters regulatory, economic, or competitive obstacles that force downward revisions. Market reports provide the baseline for measuring that outcome.
Ready to dive deeper into casino industry trends? Explore comprehensive market analysis, track regulatory developments across jurisdictions, and access the latest operator performance data to inform strategic decisions.
Related Articles

September 29, 2026Is the Casino Legal in Japan? The Real Answer...

September 29, 2026Is the Casino Legal in Gambia? What the Law...